Channel Capacity & Signal Loss: Full Engineering Guide
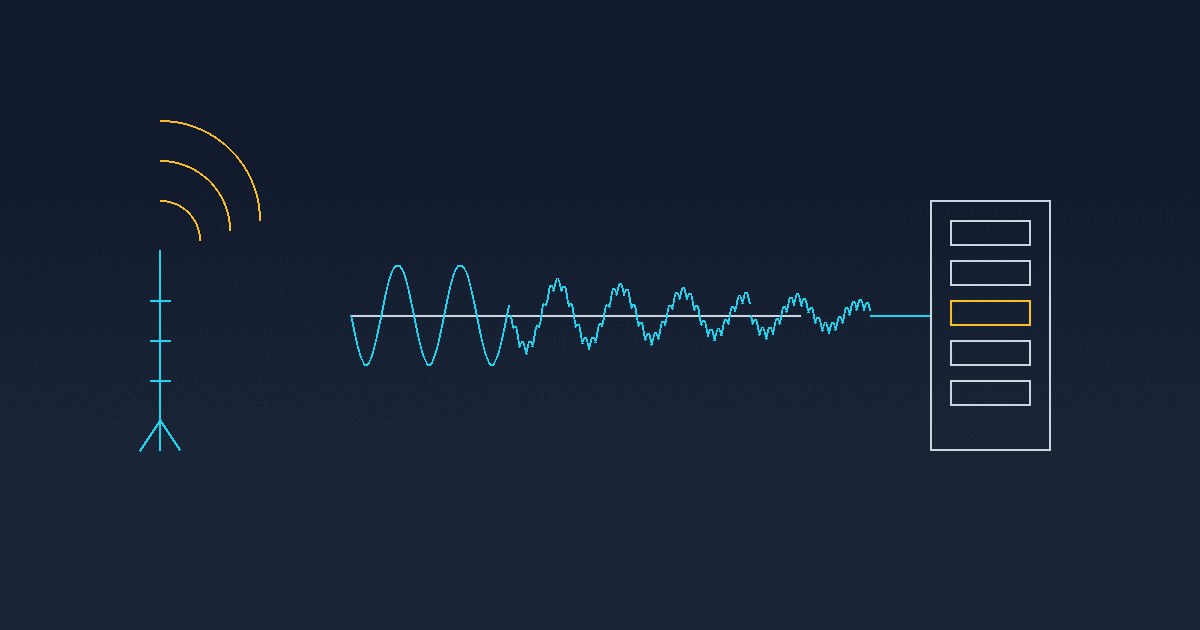
Enterprise network architecture is governed by a small set of immutable physical and mathematical laws. No amount of provisioning, QoS tagging, or vendor marketing changes the fact that a channel has a hard capacity ceiling, that signals attenuate predictably over distance, that storage redundancy consumes real capacity, and that distance imposes a propagation delay constant no protocol can circumvent. This reference walks through the exact formulas Network Engineers, RF Consultants, and Infrastructure Directors use to plan systems that hold up under real load not just pass a synthetic benchmark.
Channel Capacity Bounds: The Shannon-Hartley Ceiling
Every communication channel copper, fiber, or RF has a theoretical maximum throughput defined by the Shannon-Hartley theorem. This is not a design target; it is a hard upper bound that no modulation scheme, coding technique, or vendor optimization can exceed:
- C — channel capacity in bits per second (bps)
- B — available bandwidth in Hz
- S/N — signal-to-noise ratio, expressed as a linear power ratio, not in dB
A critical and frequently misapplied detail: S/N in this formula must be a linear ratio. If your link budget documentation expresses SNR in decibels, it must first be converted using SNRlinear = 10^(SNRdB/10) before insertion into the equation. Substituting a dB value directly into log₂(1 + S/N) is a common estimation error that produces capacity figures several orders of magnitude too high.
Worked Example: 20 MHz Wi-Fi Channel
Consider a 20 MHz 802.11 channel operating at an SNR of 25 dB. Converting to linear scale: S/N = 10^(25/10) ≈ 316.2. Applying Shannon-Hartley:
This 166.2 Mbps figure is the theoretical ceiling assuming a perfect Gaussian noise floor and zero protocol overhead. Real 802.11ac/ax deployments typically realize 55-70% of this bound once you subtract MAC-layer contention, guard intervals, and retransmission overhead which is why link budgets should always be built with the theoretical maximum as a reference ceiling, not a provisioning assumption.
Decibel Mathematics and Link Budget Construction
RF and fiber link budgets are built additively in decibels precisely because the underlying power relationships are logarithmic. Rather than multiplying linear gain and loss factors across a signal chain, engineers sum dB gain and loss values directly a design convenience that only works because of the logarithmic identity log(a × b) = log(a) + log(b).
dBm-to-Watts Conversion
A transmitter rated at 20 dBm outputs 100 mW; a 30 dBm transmitter outputs 1 W. Every 3 dB increment approximately doubles power, and every 10 dB increment multiplies power by exactly 10 a heuristic worth memorizing for rapid mental link-budget checks in the field.
Attenuation Coefficients Over Distance
Free-space path loss (FSPL), the dominant attenuation coefficient in point-to-point RF links, is calculated as:
Here, d is distance in kilometers and f is frequency in MHz. A full link budget then reduces to a single additive equation:
The resulting received power must clear the receiver sensitivity threshold with margin remaining for fade typically 10-15 dB of headroom for licensed microwave links, and 6-10 dB for unlicensed point-to-point RF, to account for rain fade, multipath, and seasonal foliage attenuation.
Propagation Delay vs. Serialization Delay
One of the most persistent confusions in enterprise WAN design is conflating propagation delay with serialization delay. They are governed by entirely different physical mechanisms and scale with different variables.
Propagation Delay Constant
Latency introduced purely by physical distance is calculated as:
where d is distance, c is the speed of light in vacuum (299,792,458 m/s), and VF is the velocity factor of the transmission medium approximately 0.67-0.70 for single-mode fiber and 0.6-0.9 for copper depending on dielectric construction. This is why a coast-to-coast US fiber circuit (~4,000 km path distance, accounting for routing, not straight-line distance) carries an irreducible one-way propagation delay near 19-20 ms, regardless of how much bandwidth is provisioned on that circuit.
Serialization Delay
Serialization delay, by contrast, depends entirely on frame size and link bit rate, with zero dependency on distance:
A 1,500-byte (12,000-bit) Ethernet frame on a 1 Gbps link takes 12 microseconds to serialize; the same frame on a 1.5 Mbps WAN circuit takes 8 milliseconds over 600 times longer, purely from the reduced bit rate. On low-bandwidth WAN links, serialization delay frequently dominates total path latency more than propagation delay does, which is why voice and real-time traffic prioritization matters most on constrained-bandwidth circuits rather than high-capacity backbone links.
Subnet Architecture and CIDR Sizing
Address space planning for enterprise networks depends on correctly applying CIDR notation to balance host density against broadcast domain size. The usable host count for any prefix length is:
The subtraction of 2 accounts for the network address and broadcast address in every subnet. This yields the following commonly deployed enterprise allocations:
| Prefix | Subnet Mask | Usable Hosts | Typical Use Case |
|---|---|---|---|
| /30 | 255.255.255.252 | 2 | Router-to-router point-to-point links |
| /27 | 255.255.255.224 | 30 | Small server VLAN or IDF closet |
| /24 | 255.255.255.0 | 254 | Standard office floor or department VLAN |
| /22 | 255.255.252.0 | 1,022 | Campus-wide user segment |
The /30 allocation for point-to-point links is a deliberate efficiency decision it wastes only 2 addresses instead of the 254 wasted by using a /24 for a link with exactly two endpoints, a meaningful conservation measure at scale across hundreds of WAN interconnects.
RAID Parity Overhead and Usable Storage Capacity
Storage architects must account for RAID capacity overhead when provisioning array sizes, since raw drive capacity and usable capacity diverge significantly depending on the redundancy scheme chosen.
| RAID Level | Usable Capacity Formula | 8-Drive Array Efficiency | Fault Tolerance |
|---|---|---|---|
| RAID 5 | (n − 1) / n | 87.5% | 1 drive failure |
| RAID 6 | (n − 2) / n | 75% | 2 drive failures |
| RAID 10 | n / 2 | 50% | 1 per mirrored pair |
RAID 6's dual-parity overhead is frequently justified by rebuild-window risk rather than raw probability: as drive capacities climb into multi-terabyte territory, RAID 5 rebuild windows can stretch to 12-24+ hours, during which a second drive failure causes total array loss with zero parity remaining. RAID 6 tolerates that second failure at the cost of 12.5 additional percentage points of capacity in an 8-drive array a trade-off enterprise storage teams increasingly accept as drive capacities scale faster than rebuild throughput.
Bit Error Rate Curves and Fade Margin Design
Bit error rate (BER) does not degrade linearly as SNR falls it degrades according to a complementary error function relationship specific to the modulation scheme in use. For BPSK, the relationship approximates:
where Q is the Gaussian tail function and Eb/N₀ is energy-per-bit-to-noise-density ratio. The practical consequence is that BER curves are extremely steep near the modulation's threshold SNR: a 1-2 dB drop below threshold can shift BER from 10⁻⁹ (effectively error-free) to 10⁻ⁱ (unusable) within a narrow window. This nonlinearity is precisely why link budgets are designed with fade margin well above the theoretical minimum rather than targeting the threshold directly a link engineered to the exact SNR floor has zero tolerance for the diurnal and seasonal variance every real-world RF or fiber path experiences.
Frequently Asked Questions
How does the Shannon-Hartley theorem determine maximum channel capacity?
C = B log₂(1 + S/N) defines the theoretical ceiling on error-free throughput, where SNR must be converted from dB to a linear ratio before substitution. Real-world systems typically achieve 60-80% of this bound once modulation overhead and error correction are accounted for.
What is the formula for converting dBm to watts?
P(mW) = 10^(dBm/10). A 20 dBm signal equals 100 mW; a 30 dBm signal equals 1 W. Every 3 dB roughly doubles power, and every 10 dB multiplies it by 10.
How is propagation delay calculated over fiber and copper links?
t = d / (c · VF), where VF is roughly 0.67-0.70 for fiber and 0.6-0.9 for copper. This is distinct from serialization delay, which depends on frame size and bit rate rather than distance.
What percentage of raw capacity is lost to RAID parity overhead?
RAID 5 yields (n-1)/n usable capacity, RAID 6 yields (n-2)/n, and RAID 10 always yields exactly 50%. In an 8-drive array that's 87.5%, 75%, and 50% respectively.
How does CIDR notation determine usable host addresses?
Usable hosts = 2^(32-prefix) - 2. A /24 yields 254 hosts, a /27 yields 30, and a /30 standard for point-to-point links yields exactly 2.
Why does bit error rate increase disproportionately as SNR degrades?
BER follows a complementary error function, not a linear curve, so a 1-2 dB drop near the modulation threshold can shift error rates by several orders of magnitude the reason link budgets include fade margin well above the theoretical minimum.