Compression, VE & Suspension Kinematics Guide
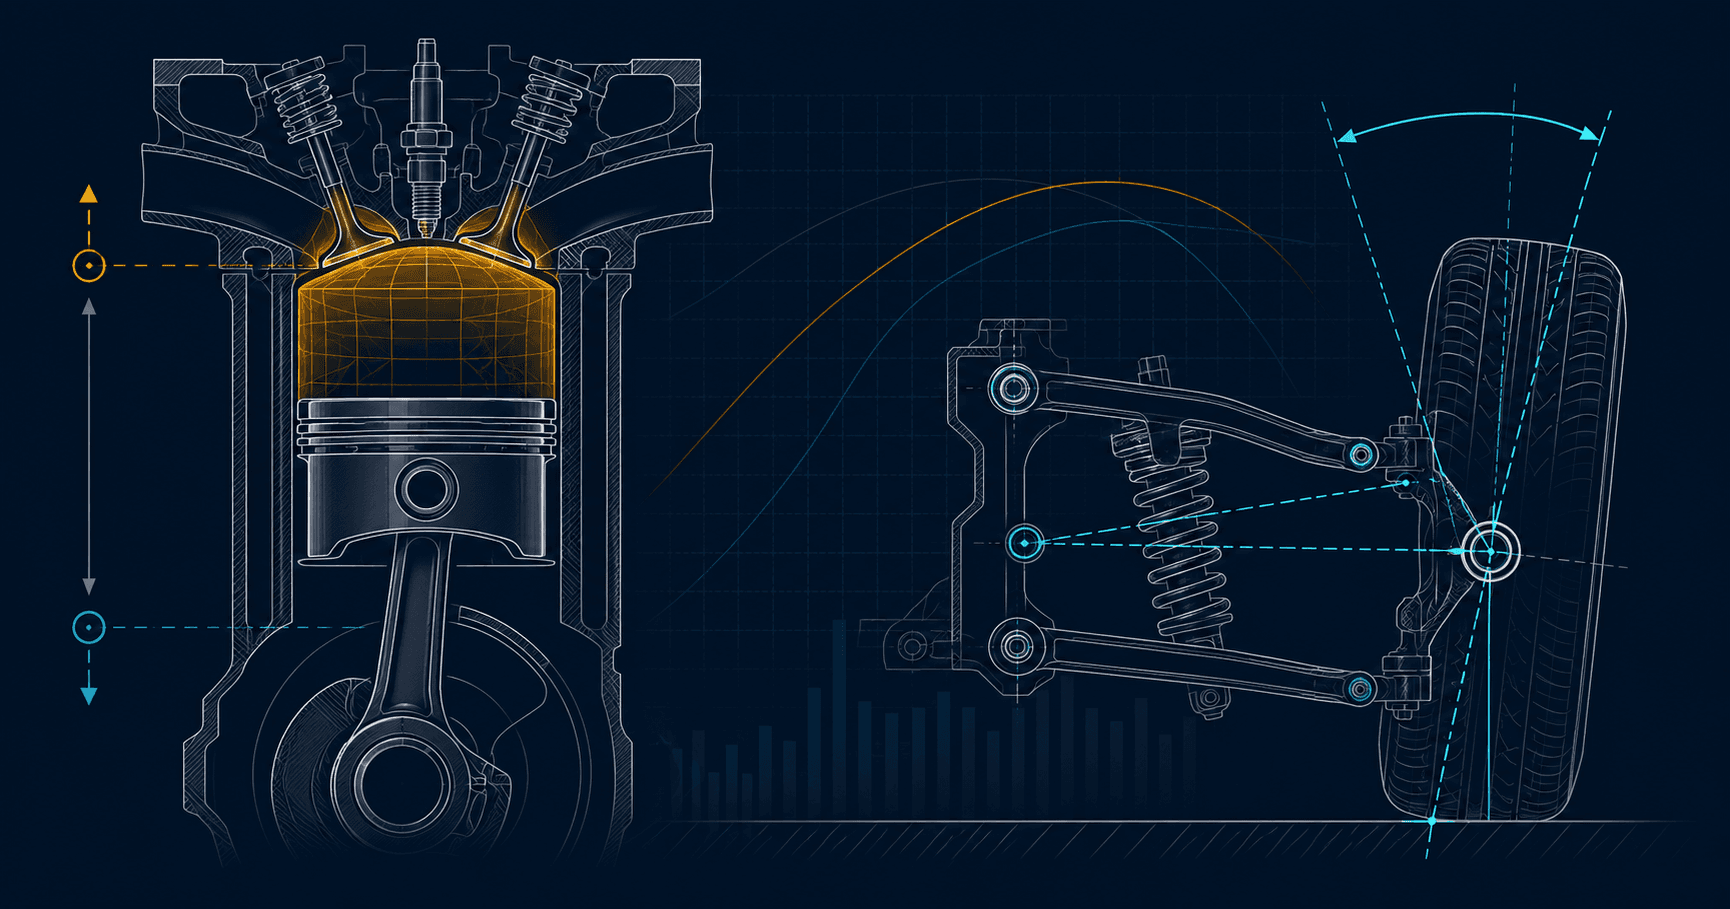
Powertrain Engineering · Chassis Dynamics · Fluid Mechanics
Volumetric Efficiency, Compression Dynamics, and Suspension Kinematics: A Technical Tuning Framework for Performance Builders
Every performance build ultimately reduces to three coupled physics problems: how much air-fuel charge a cylinder can trap and burn per cycle, how efficiently the crankshaft converts expanding gas pressure into torque, and how the chassis manages the resulting load transfer through a controlled geometric arc. This guide breaks down the thermodynamic, rotational, and kinematic boundaries that govern each domain, with the empirical formulas performance tuners actually use at the bench and on the dyno.
Swept Volume and Engine Displacement Calculations
Engine displacement is the aggregate swept volume of all cylinders between top dead center (TDC) and bottom dead center (BDC). It is the single most cited spec in a build sheet, yet most tuners treat it as a fixed constant rather than a variable they can engineer around bore, stroke, and deck height changes.
Where B = bore diameter, S = stroke length, N = cylinder count. Units in cm³ require B and S in centimeters.
A worked example: a 4-cylinder engine with an 86 mm bore and 86 mm stroke (a "square" configuration) yields a per-cylinder swept volume of approximately 499.56 cm³, scaling to 1,998.2 cm³ total the familiar "2.0L" nominal class. Bore-up machining to 87 mm with the same stroke pushes swept volume to roughly 511.6 cm³ per cylinder, a 2.4% gain that shifts peak torque RPM downward slightly due to the altered bore/stroke ratio and its effect on mean piston speed.
Mean piston speed (MPS) is the practical ceiling on displacement-driven RPM headroom:
Production gasoline engines are typically bounded near 20–23 m/s MPS before piston skirt scuffing and connecting rod fatigue become limiting factors; race-spec forged internals with tighter tolerances can push toward 25–26 m/s. Any stroke increase for displacement gains directly raises MPS at a given RPM, which is why long-stroke torque builds usually accept a lower redline in exchange for cylinder pressure and low-end grunt.
Static vs. Dynamic Compression Ratio
The Compression ratio quoted on a spec sheet is almost always the static figure a geometric ratio with no regard for cam timing or cylinder filling dynamics:
Vd = swept cylinder volume per cylinder, Vc = combustion chamber clearance volume (head chamber + piston dish/dome + head gasket compressed volume + deck clearance).
Static compression ratio is a poor predictor of knock margin or cylinder pressure at the point of ignition because it ignores when the intake valve actually closes relative to BDC. Dynamic compression ratio (DCR) corrects for this by substituting the effective swept volume from intake valve closing (IVC) point to TDC:
Veff is derived from crank angle at IVC using the piston position formula: x = r(1−cosθ) + (r²/4L)(1−cos2θ), where r = crank radius (stroke/2), L = connecting rod length, θ = crank angle after BDC.
A cam with late IVC (common on high-RPM performance profiles due to intake reversion control) reduces effective trapped volume, which lowers DCR even while SCR stays fixed. This is precisely why two engines can share an identical 11.5:1 static ratio on paper yet require a two-point difference in octane the one with the milder cam retains more cylinder pressure and needs the higher-rated fuel to suppress detonation, while the wilder cam bleeds off enough dynamic pressure to run comfortably on regular pump gas despite the aggressive static number.
Most naturally aspirated performance builds target a DCR between 7.5:1 and 8.5:1 on 91–93 octane pump fuel; boosted applications typically hold DCR closer to 6.5:1–7.8:1 to preserve knock margin once manifold pressure is added on top of the mechanical ratio.
Volumetric Efficiency and Thermodynamic Boundaries
Volumetric efficiency (VE) measures how completely a cylinder fills relative to its theoretical swept displacement under ambient reference conditions:
ma = actual mass of air inducted per cycle, ρamb = ambient air density, Vd = swept displacement per cylinder.
Naturally aspirated engines are thermodynamically bounded below 100% VE by intake tract friction losses, valve curtain area restriction during early lift, and reversion pulses from adjacent cylinders sharing a common plenum. Well-tuned NA performance heads with matched runner length and velocity stacks can reach 95–100% VE at the intake's tuned resonance RPM, with a typical falloff to 80–85% outside the tuned band. Forced induction removes this ceiling entirely VE figures of 130–180% are routine on turbocharged and supercharged applications because the boundary condition is no longer atmospheric density but manifold absolute pressure (MAP) delivered by the compressor.
The Otto cycle's thermal efficiency ceiling remains the deeper constraint underneath VE:
r = compression ratio, γ = specific heat ratio (≈1.3–1.35 for gasoline-air mixtures).
This is the thermodynamic reason raising compression ratio yields efficiency gains independent of VE each unit increase in r produces diminishing but real gains in ideal cycle efficiency, which is why modern direct-injection engines chase higher static ratios (12:1–14:1) using cooled EGR and precise injection timing to manage the knock penalty that would otherwise offset the thermodynamic benefit.
Fuel Delivery: BSFC and Injector Duty Cycle
Brake Specific Fuel Consumption (BSFC) normalizes fuel flow against actual power output, making it the correct metric for sizing injectors rather than raw horsepower targets alone:
Ẋ = mass fuel flow rate (lb/hr), P = brake power (hp). Typical NA gasoline BSFC: 0.45–0.50 lb/hp·hr. Turbocharged engines run richer at boost, commonly 0.55–0.65 lb/hp·hr under load.
Injector sizing follows directly from BSFC and target power, then must be checked against duty cycle headroom. The Injector duty cycle is the percentage of the available cam cycle time the injector spends open:
Max duty cycle is conservatively capped at 80–85%; sustained operation above 90% risks pintle flutter, heat soak, and nonlinear pulse-width response at the margins.
Example: a 400 hp target on a 4-cylinder engine at 0.55 lb/hp·hr BSFC and an 85% duty cycle ceiling requires (400 × 0.55) / (4 × 0.85) ≈ 64.7 lb/hr injectors per cylinder. Undersizing forces duty cycle past the safe ceiling at high RPM, producing a lean-out precisely when cylinder pressure and knock sensitivity are highest a common cause of tuning-induced detonation on otherwise sound short blocks.
Rotational Forces and Rod Ratio
Connecting rod ratio (R = rod length / stroke) governs piston acceleration profile and secondary side-loading against the cylinder wall. Piston acceleration as a function of crank angle:
r = crank radius, ω = angular velocity (rad/s), θ = crank angle, R = rod ratio.
Lower rod ratios (below 1.6:1) increase peak piston acceleration near TDC and amplify secondary side-thrust loading, accelerating cylinder wall and ring-land wear but improving low-RPM torque character due to a longer dwell near TDC that sustains cylinder pressure into the early power stroke. Higher rod ratios (1.75:1 and above) reduce side loading and piston speed variance, favoring sustained high-RPM durability the reason drag and endurance race engines specifically favor tall-deck blocks that permit longer rods at a given stroke.
Reciprocating and rotating mass also determine the crankshaft's dynamic balance requirement. Bobweight calculation for balancing:
Reciprocating factor is typically 50% for street/strip builds and up to 100% for oval-track applications where unidirectional loading dominates.
Gear Ratios and Final Drive Axle Metrics
Engine output must be matched to the road through a gear train, and the Gear ratio at each stage multiplies torque while dividing rotational speed. Overall reduction combines transmission gear and final drive axle ratio:
Drivetrain efficiency typically 0.88–0.94 for a well-maintained manual gearbox with limited-slip differential; automatic transmissions with torque converters trend lower (0.82–0.90) due to hydraulic coupling losses below lockup.
Road speed at a given RPM is the inverse relationship, essential for selecting a final drive that keeps the engine within its powerband at redline in top gear:
A shorter final drive (higher numerical ratio, e.g., 4.10:1 vs. 3.55:1) improves wheel torque and off-the-line acceleration at the cost of higher cruise RPM and reduced top-end speed a direct trade-off tuners must balance against the engine's torque curve shape and intended use case, whether that's autocross corner-exit acceleration or top-speed circuit work.
Suspension Arc Geometry and Unsprung Mass
Chassis dynamics are governed by how the suspension's control arms constrain the wheel's motion through an arc rather than a straight vertical line. Camber gain the change in wheel camber angle through suspension travel is a direct function of control arm length and mounting angle:
Δγ = angular camber deflection in degrees, Δz = vertical wheel travel, Larm = effective control arm length (instant center to contact patch approximation).
Shorter control arms produce steeper camber curves more angular camber deflection per inch of suspension travel which can be desirable for maintaining contact patch alignment through heavy roll on a dedicated track car, but introduces excessive camber change over bumps and curbing on street-driven setups. Roll center height, derived from the intersection of front-view swing arm lines projected from each control arm's instant center, further determines how much of the chassis's roll moment is reacted geometrically versus through spring and anti-roll bar rates.
Unsprung mass wheels, tires, brake rotors/calipers, hub assemblies, and the portion of control arms and driveshafts not supported by springs directly governs how quickly the suspension can react to surface irregularities:
fn = unsprung natural frequency, k = combined spring and tire vertical stiffness rate, munsprung = unsprung mass per corner.
Reducing unsprung mass raises this natural frequency, allowing the wheel to track the road surface with less lag relative to sprung mass motion the fundamental reason forged wheels, lightweight rotors, and hollow axles produce a disproportionate ride and grip improvement relative to their weight savings compared to equivalent reductions in sprung (chassis) mass.
Frequently Asked Questions
Why does dynamic compression ratio matter more than static compression ratio for octane selection?
Static compression ratio only describes the geometric volume ratio between BDC and TDC. Dynamic compression ratio accounts for the actual trapped charge from the point the intake valve closes, which is what determines real cylinder pressure at ignition and therefore actual knock margin.
How do I know if my injectors are undersized?
If calculated injector duty cycle exceeds roughly 85% at your target power and RPM, the injectors are undersized. Data-logged fuel trims that go lean specifically at high RPM and wide-open throttle are the practical symptom of this ceiling being reached.
Does a shorter final drive ratio always improve acceleration?
Only within the engine's usable RPM range in each gear. A final drive that is too short causes the engine to hit redline before reaching the next gear's effective speed range, which can cost overall acceleration despite higher instantaneous wheel torque.
Why does reducing unsprung mass matter more than reducing overall vehicle weight for handling?
Unsprung mass sits below the springs and must be accelerated directly by every road surface irregularity. Lowering it raises the wheel assembly's natural frequency, letting the tire maintain contact patch pressure over bumps more effectively than an equivalent reduction in sprung chassis weight.