The Real Math Behind Baking, Tire Size & BMI Ratios
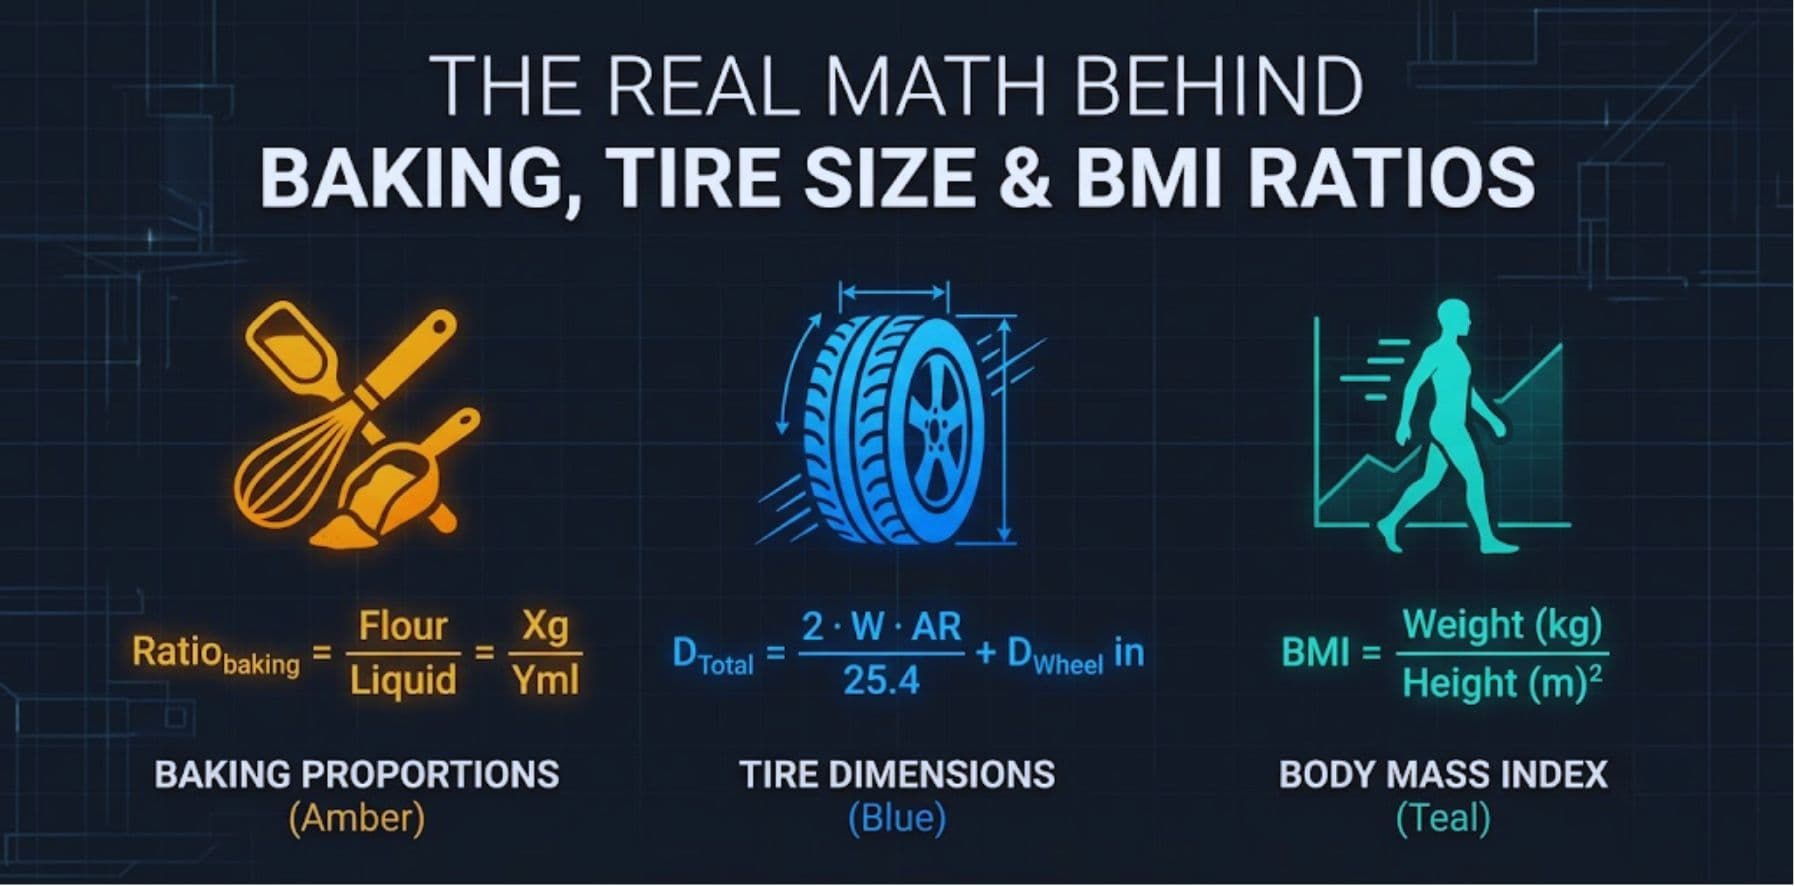
Every kitchen scale, tire sidewall, and bathroom mirror is quietly running a math problem. Whether you're proofing a high-hydration sourdough, decoding the cryptic string of numbers stamped into a tire's sidewall, or checking a body composition threshold before a physical, the underlying discipline is the same: precise, repeatable unit conversion. This guide walks through the exact formulas and parameters behind three of the most consequential everyday calculations culinary ratios, tire dimensional geometry, and health metrics so you can apply them with confidence instead of guessing.
Culinary Science: Precision Baking and Ingredient Conversion
Professional bakers abandoned volume measurement decades ago for a simple reason: a "cup" is a unit of space, not mass, and ingredient density varies wildly depending on how it's scooped, sifted, or packed. A cup of all-purpose flour can weigh anywhere from 120g to 150g depending on technique, while a cup of granulated sugar sits much more consistently near 200g because sugar crystals pack more predictably than flour's aerated particles. This is the core reason weight-based recipes are more reproducible than volume-based ones.
Why Weight Beats Volume: The Science of Ingredient Density
Density (mass per unit volume) is not fixed for dry ingredients the way it is for water. Flour compresses under its own weight during shipping and storage, meaning a "cup" scooped from a freshly opened bag differs from one scooped from a bag that's settled for weeks. Liquids like water, milk, and oil behave far more predictably, since their density doesn't change with handling 1 cup of water reliably converts to almost exactly 236.6 grams. This inconsistency in dry-goods density is precisely why converting between grams and cups requires ingredient-specific density values rather than a single universal factor.
Baker's Percentages and Hydration Ratios
In professional formulas, every ingredient is expressed as a percentage of the total flour weight, which is fixed at 100%. This is called baker's percentage. A dough listing 500g flour, 350g water, 10g salt, and 5g yeast is expressed as 100% flour, 70% water, 2% salt, and 1% yeast. That 70% water-to-flour ratio is the hydration ratio the single most important variable in determining crumb structure. Low-hydration doughs (55–65%) produce dense, tight-crumbed breads like bagels; high-hydration doughs (75–85%) produce the open, irregular crumb associated with rustic sourdough and ciabatta.
| Ingredient | Grams per 1 Cup (approx.) | Measurement Note |
|---|---|---|
| All-purpose flour (spooned & leveled) | 120g | Scooping directly from the bag can add 15–25g of excess weight |
| Granulated sugar | 200g | Crystalline structure packs consistently |
| Brown sugar (packed) | 220g | Molasses content requires firm packing for accuracy |
| Unsalted butter | 227g | Standard US stick equals 1/2 cup (113g) |
| Whole milk | 245g | Near-parity with water due to high water content |
| Honey | 340g | High viscosity increases mass per unit volume significantly |
Because these density values shift by ingredient, brand, and technique, converting a family recipe between grams and cups or scaling a formula up for a larger batch while preserving hydration ratio is best handled with a dedicated reference rather than a flat multiplier. The Cooking Unit Converter accounts for these ingredient-specific densities directly, letting you move between grams, ounces, cups, and tablespoons without manually tracking density tables for every ingredient in a recipe.
Automotive Mechanics: Decoding Tire Size and Sidewall Geometry
A tire sidewall code like P215/65R15 looks arbitrary, but it's a compact geometric specification. Each segment encodes a physical dimension that determines fitment, load capacity, and how the tire behaves under cornering and load misreading it can mean a speedometer that's off by several percent or a tire that physically doesn't clear the wheel well.
Breaking Down the Tire Size Code
- P Tire class "P" denotes P-metric (passenger), "LT" denotes Light Truck, each with different load index scaling.
- 215 Section width in millimeters the tire's width measured from outer sidewall to outer sidewall.
- 65 Aspect ratio profile sidewall height as a percentage of section width (explained below).
- R Construction type "R" for radial, the standard on nearly all modern consumer tires.
- 15 Wheel diameter in inches the rim size the tire is designed to seat on.
Calculating Sidewall Height and Aspect Ratio
The aspect ratio profile is not an absolute measurement it's a ratio applied against the section width, and this is where most DIY calculations go wrong. For a 215/65R15 tire, sidewall height is calculated as: 215mm × 0.65 = 139.75mm. Converting to inches (÷25.4) gives a sidewall height of roughly 5.5 inches. This sidewall height directly determines sidewall deflection how much the tire's sidewall flexes under load and cornering force. Lower-profile tires (aspect ratios of 35–45) have shorter, stiffer sidewalls that resist deflection for sharper steering response, at the cost of a harsher ride and increased vulnerability to pothole damage. Higher-profile tires (60–75) flex more, absorbing road imperfections but introducing more lateral roll during hard cornering.
Overall Diameter, Speedometer Calibration, and Fitment
Overall tire diameter is the figure that actually matters for speedometer accuracy and gearing: (sidewall height × 2) + wheel diameter in mm. For our 215/65R15 example: (139.75mm × 2) + (15 × 25.4mm) = 279.5mm + 381mm = 660.5mm, or about 26 inches. If you upsize to a 215/45R17 to fit a wider rim, the new sidewall height is 215 × 0.45 = 96.75mm, giving an overall diameter of (96.75 × 2) + (17 × 25.4) = 193.5 + 431.8 = 625.3mm roughly 35mm smaller than the original. That difference of just over an inch in overall diameter is enough to throw off a speedometer reading by 2–3%, and on some vehicles, trigger an ABS or traction control fault due to mismatched wheel rotation speed sensors.
| Parameter | Formula | 215/65R15 Example |
|---|---|---|
| Sidewall height (mm) | Section width × (Aspect ratio ÷ 100) | 139.75mm |
| Wheel diameter (mm) | Rim size (in) × 25.4 | 381mm |
| Overall diameter (mm) | (Sidewall height × 2) + Wheel diameter | 660.5mm (~26 in) |
| Circumference (mm) | Overall diameter × π | ~2,075mm |
Because a single-digit change in section width or aspect ratio compounds through every downstream calculation, comparing two tire sizes by hand invites rounding errors that matter at highway speed. The Tire Size Decoder runs these formulas automatically and lets you compare two full sidewall codes side by side, flagging the resulting diameter and speedometer variance percentage before you commit to a wheel or tire change.
Health Informatics: Body Composition and Metabolic Ratios
Body composition thresholds are another place where a simple-looking number hides a specific formula and a set of well-documented limitations. Understanding both the math and its blind spots is what separates a useful self-check from a misleading one.
The BMI Formula and Its Real-World Limitations
Body Mass Index is calculated as weight in kilograms ÷ (height in meters)², or in imperial units, 703 × weight in pounds ÷ (height in inches)². For someone weighing 80kg at a height of 1.75m: 80 ÷ (1.75 × 1.75) = 80 ÷ 3.0625 = 26.1. That places this individual just inside the "overweight" classification band. The formula is deliberately simple it was designed in the 1830s for population-level statistical analysis, not individual diagnosis which is why it doesn't distinguish between muscle mass and fat mass. A muscular athlete and a sedentary individual of identical height and weight will return an identical BMI despite very different body composition.
| BMI Range | Classification |
|---|---|
| Below 18.5 | Underweight |
| 18.5 – 24.9 | Normal weight |
| 25.0 – 29.9 | Overweight |
| 30.0 and above | Obese (Class I–III by sub-thresholds) |
Waist-to-Height Ratio: A More Nuanced Metabolic Indicator
Because BMI can't see where fat is distributed, many clinicians pair it with the waist-to-height metric: waist circumference ÷ height, using consistent units for both. A ratio above 0.5 is widely used as a threshold flagging increased cardiometabolic risk, since visceral abdominal fat is more strongly associated with cardiovascular and metabolic disease than fat stored elsewhere on the body. Someone with a 90cm waist and a 180cm height returns a ratio of 0.5 exactly right at the threshold regardless of what their BMI alone might suggest.
Used together, these two metrics compensate for each other's blind spots: BMI gives a fast, standardized population comparison, while waist-to-height ratio adds a distribution-sensitive check. For a quick, accurate calculation across either metric including automatic unit handling between metric and imperial inputs the Body Mass Index (BMI) tool removes the manual squaring and unit-conversion steps that most easily introduce error by hand.
Bringing It Together: Applying Conversion Science to Daily Life
What connects a hydration ratio, an aspect ratio profile, and a waist-to-height threshold is that each represents a real physical property expressed as a relationship between two measurements rather than a raw number. Getting comfortable reading these relationships and knowing which formula sits behind each one turns a conversion tool from a shortcut into an instrument you actually understand. Whether you're scaling a bread formula for a larger batch, comparing two tire fitments before a wheel swap, or tracking a body composition trend over months, the math is consistent, reproducible, and worth knowing by heart even when a calculator is doing the arithmetic for you.